THU-BDC2026 Retrospective: I Almost Got Fooled by a Beautiful Backtest
Origin
For this THU-BDC2026, I actually kept three project directories: the original, archive, and v2. They look like three projects, but after going through them, a more accurate description is: this is the three-stage growth history of the same competition project.
The problem itself is very direct: based on the historical market data of CSI 300 constituent stocks, rank the stocks, select the Top 5 to form a portfolio, and then assign weights to them. Put plainly, it asks the model to answer a very practical question: over the next period, which stocks deserve to be ranked higher?
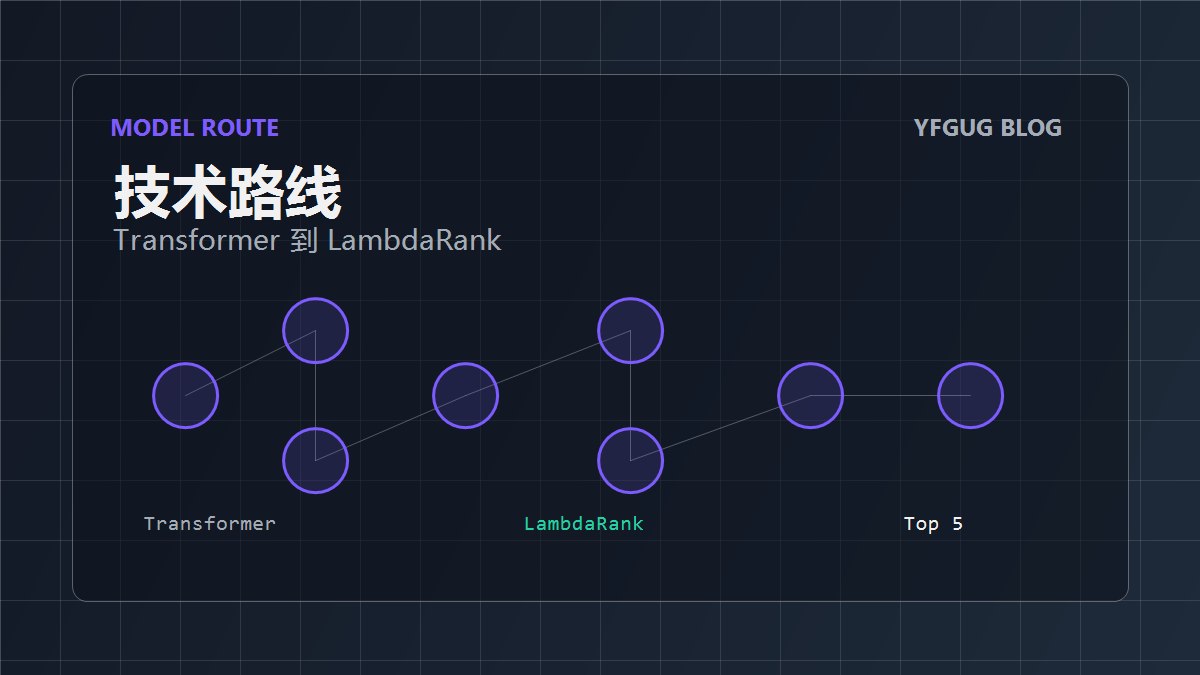
At first I was very excited, because this problem naturally lends itself to writing something very “advanced”: Transformer, CrossStockAttention, MoE, cross-sectional standardization, Top 5 softmax weights. Stacking up the keywords looked beautiful, and the code really did run.
But later I found that the scariest thing in finance competitions is not that the model is not complex enough, but that the model looks too right.
First Version: Looked Impressive
The earliest approach was the deep model route.
I used the past 30 trading days as the time window, calculated 72 technical indicators for each stock, and then constructed a four-dimensional tensor:
1 | [batch, 股票数, 30天, 特征数] |
The model structure was roughly:
- StockTransformer to model time series;
- CrossStockAttention to model relationships between different stocks on the same day;
- MoE Ranking to increase model capacity;
- Finally output a ranking score for each stock and take the Top 5.
From an engineering perspective, this solution was quite complete, and even had a bit of a “competition flavor.” But in quant, you cannot just look at whether the structure is pretty; the core is still whether the backtest can withstand scrutiny.
The Bug That Calmed Me Down
Later I found a very serious problem in the backtest code: training data filtering only used data before the prediction date.
The original logic was similar to this:
1 | train_proc = processed[processed['日期'] < bt_date].copy() |
The problem is that the labels were calculated using the opening prices of the next 5 days. That is, although the samples from the few days before the prediction date had dates earlier than the prediction date, their labels might already contain future price information around the prediction date.
After the fix, I separated the training samples from the prediction date:
1 | train_proc = processed[ |
After this cut, the results were very ugly.
| Metric | Claimed Before Fix | Backtest After Fix |
|---|---|---|
| Sharpe | 2.30 | -0.49 |
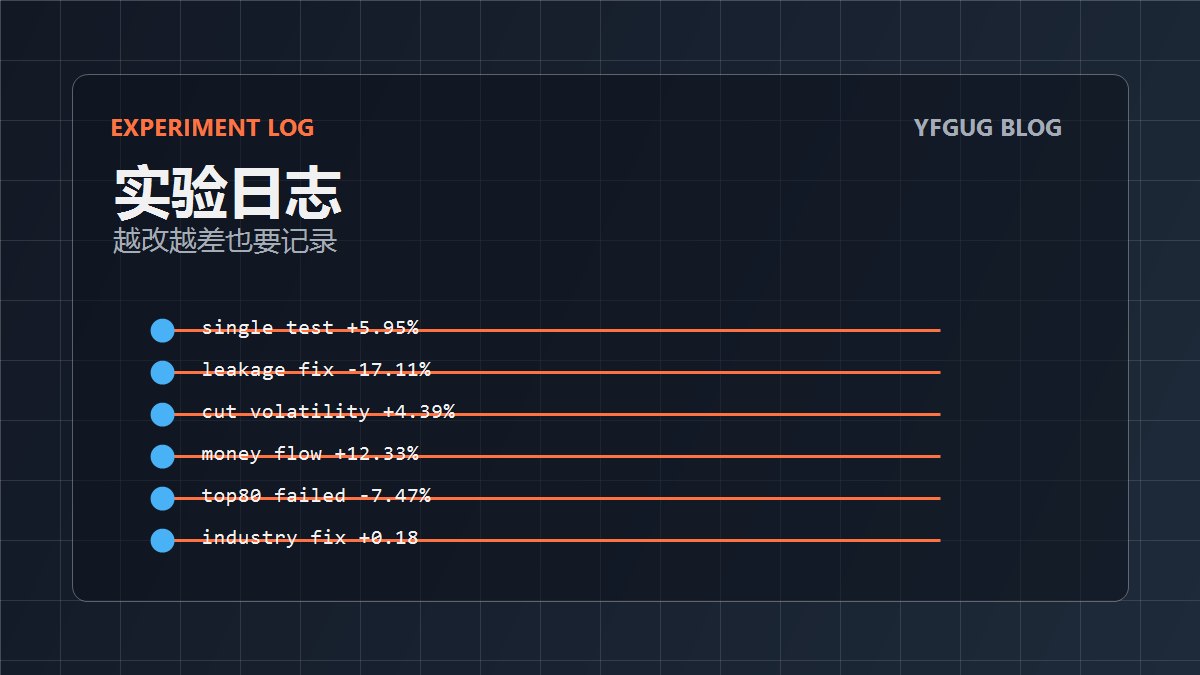
| Cumulative Return | - | -17.11% |
| Win Rate vs Equal Weight | - | 44.8% |
| Max Drawdown | - | -31.17% |
The worst part was not the loss, but that I had to admit: that beautiful result from before was not trustworthy.
Starting Over with a More Honest Version
After fixing the data leakage, I did not continue piling things onto the model. Instead, I first did subtraction.
I found that some volatility-related features were especially “useful” when leakage existed, but after the fix they acted more like noise sources. So I removed vol_5d, vol_10d, vol_20d, boll_pctb, boll_width, and atr_pct.
The feature dimension dropped from 289 to 227, and the backtest actually got better:
| Version | Sharpe | Cumulative Return | Win Rate |
|---|---|---|---|
| Baseline after leakage fix | -0.49 | -17.11% | 44.8% |
| Removing volatility features | 0.40 | 4.39% | 51.7% |
This step gave me a big reminder: more features is not always better. Some features look especially smart under the wrong validation method, but once validation becomes clean, they expose themselves.
Tushare-Enhanced Version: A More Decent One
Later I added Tushare’s capital flow factors and Shenwan industry classification, mainly including:
- Main force net inflow rate;
- Small order net inflow rate;
- Extra-large order proportion;
- Industry and market cap related features.
This version had the best staged backtest performance:
| Metric | Tushare-Enhanced Version |
|---|---|
| Sharpe | 0.70 |
| Cumulative Return | 12.33% |
| Annualized Return | 29.90% |
| Win Rate vs Equal Weight | 51.7% |
| Max Drawdown | -25.13% |
Among them, 主力净流入率_ma20_cs_rank entered the Top 20 feature importance, which shows that capital flow factors really did provide some extra information.
But I also do not want to write this as “finally succeeded.” Because the backtest window was only a rolling test from 2024 to 2026, and after removing the best months, return stability clearly weakens. It is a staged better version, not a god model that can be bragged about for a lifetime.
The Attempts That Didn’t Improve
There were several interesting failures later in this project.
I tried Top-80 feature selection. Training time did drop from 116 minutes to 50 minutes, but Sharpe fell from 0.70 to -0.07. The reason is probably that important features from before 2023 do not necessarily transfer to 2024-2026.
I also tried three-class labels, splitting stocks into “top 30% / middle 40% / bottom 30%.” The result was even worse, with Sharpe falling to -1.08. Later I thought it made sense: a stock ranking task needs to retain as much relative order information as possible, and crude three-class classification erases the middle information instead.
Another time I fixed industry coverage from 4.7% to 100%. It sounds like it must be right, but the backtest fell from 0.70 to 0.18. This result is very counterintuitive, and also quite real: more complete data does not mean the model is necessarily better. If the model relies too heavily on industry features, fixing metadata may also lead it astray.
Biggest Takeaway
The biggest lesson this competition gave me was not some model structure, nor some metric, but four words: don’t fool yourself.
In financial machine learning, the most dangerous thing is “looks reasonable.” Code runs, curves look good, metrics are high—none of these automatically prove that the model really has predictive power.
What really matters is:
- Whether labels peeked at the future;
- Whether the training set and prediction date were isolated;
- Whether the backtest window is too short;
- Whether the best month propped up all the returns;
- Whether feature importance is just an illusion from a certain period;
- Whether an improvement was just a coincidence.
This article only records the competition and backtest retrospective, and does not constitute any investment advice.
If I do similar projects in the future, I will put backtest hygiene, data leakage checks, and rolling validation first. Models can become complex gradually, but once the validation method is wrong, all subsequent efforts will be led into a ditch.
The most valuable part of this time may be that I really fell into it once, and then recorded it.